Category: Allgemein

  • A brief study on sharpening stones – Part 3 – TSPROF Blitz F1000 (Extra Fine, Galvanic Diamond)

    This is part of a series of blog posts – looking into the appearance and composition of commercially available sharpening stones. If you are interested in the previous episode, Part 1 is about the Fällkniven DC3. Part 2 is about the DMT mini W7C

    If you have some suggestion on what I should look at next, or want to share your super secret DIY stones, I could be persuaded to open the bag of analytical devices… hit me up on Instagram under @marvgro for that.

    Today’s sharpening stone is actually one in two conditions. I recently aquired a TSPROF K03 Pro Hunter sharpening system. After DIY-messing-it-up twice to make a similar system and loosing the wish to continue sharpening knifes over the past decade, I decided it’s time to go for another round in the why-is-this-not-electric-powered. Or maybe my friend Roman Kasé bought one, and I generally try to imitate the master of steel as much as I can when it’s about sharpness. 🙂

    The Blitz F1000 is a galvanic bound diamond grinding stone. Yes, we are noticing a pattern here. Why are there so many galvanic bound stones? Generally, because they are dirt cheap to make. Let me share the process by which you create galvanic bound stones with you: First, you take a metal substrate that is conducting. You sprinkle some diamonds on top. Then you immerse it in a (typically blue) solution containing nickel-ions, apply some voltage for a couple of minutes. The first growth of the electro-deposited nickel matrix starts away from the stone, as that one functions as part of your anode-cathode system. After a short amount of time, you remove it, brush off the excess diamond (only the submost layer will stick if you time it right!), transfer it into a second bath of nickel-solution, and continue the electrodeposition for a couple more minutes. The whole process is ghastly unhealthy, energy intensive and cheap enough that even in Germany companies are producing grinding media this way.

    Now, the TSPROF F1000 is the “finest” of the galvanic bound diamond stones in the TSPROF set of 5 stones. The grit, according to the manufacturer is 1000, which should be somewhere in the range of 17 µm. This is already very fine and quite difficult to make on galvanic bound grinding media.

    Optical micrographs of a brand new TSPROF Blitz F1000. The scale bar is visible in the lower right corner. Measurement Instrument: Leica EMSPIRA.

    Optical micrographs show a smooth, regular surface with slight dents and fractures along the circumference and the edges. This doesn’t hurt the function, and I think the corner might also be from me, using it to scratch in a part number on a blade I was sharpening…

    The real magic is revealed inside the SEM, as usual. Unfortunately, 6″x 1″ large grinding stones don’t fit into the desktop SEM we have, so the “big one” has to come to the rescue. The upside for you: pictures are so much better. This is taken on the Zeiss GeminiSEM560, a ultra high resolution field emission gun scanning electron microscope, featuring a nano-twin lens that combines the magnetic and electrostatic field into the last lens. If you get really close, this beast has sub-nanometre resolution across the whole voltage spectrum. Resolution improves over the desktop model by nearly 3 orders of magnitude. It’s likely the most expensive SEM you can buy, and probably the first time one of these sees a knife grinding stone 🙂 The magnification is defined identically to our other SEM (polaroid standard comparison), so you can easily cross reference with previous (and future) blog entries from the other SEM.

    SEM Micrographs of the surface morphology of the unused TSPROF Blitz F1000 sharpening stone. Microscope: Zeiss GeminiSEM560.

    The SEM micrographs reveal quite the even spacing between grains. Some are embedded very far, whereas others are peaking out massively. In my professional opinion, this is the result of someone who has a very decent workflow in preparation (spacing), but struggles with the very fine grain size. Grain size distribution is pretty even, and the grains are very sharp and flat ones. This is one hell of an abrasive stone. Good thing it’s meant to do abrasion!

    White light interferometry height map of the diamond surface. Instrument used: Zygo Nexview NX2, Objective Lens: 10X. Stitched overview of 4×4 images.

    White light interferometry looks a bit weird at first glance. In the SEM pictures, the grains weren’t this densely packed together. It shows large regions with higher and lower parts, but the difference between these should be measured in low single digit µm. This is likely height variations of the matrix we are detecting here! Zooming in a bit into the overview reveals the actual grains:

    White light interferometry height map of the diamond surface. Instrument used: Zygo Nexview NX2, Objective Lens: 10X.

    Fortunately, the ISO 25178 parameters are, while dependent on the area you select, pretty robust. Once you capture around 40 roughness creating events in every direction, your parameters don’t change a lot, and we can get away with a single parameter table this time.

    Unsurprisingly, this is the smoothest stone with the lowest numbers so far. Even if you were to directly “imprint” the surface of this stone onto your knife, your surface roughness would be just above 1 µm. That’s often a challenge in steel for mediocre milling machines. The edges made by this stone are, while not glossy, already very fine, sharp and shiny.

    In the beginning of this post, I teasered that this stone will be featured in two conditions – and the second is obviously, used! I’ve sharpened a grand total of 4 blades on it – 3 from M398 at 68 HRC, 1 in nitro-x at 64 HRC. This is quite the “hard” and demanding steel, but not a lot of used. I’ve. then repeated the metrology we see here, so we can see the initial wear of such a stone. At this point, let me mention that the stone is still perfectly fine and works just like it did new. But it gives a very nice first impression on what is happening during grinding.

    The optical micrographs look pretty similar. The stone was cleaned with a steam cleaner, ultrasonic bath (ethanol, 5 minutes) and then blow dried with pure nitrogen gas.

    Optical Micrograph of the Blitz F1000 in lightly used condition. Note: the corner didn’t magically reappear, I just own two sets of these stones. Microscope: Leica Emspira.

    SEM micrographs are really interesting this time. You can immediately see a large amount of torn out grains, but also of massive, swarf induced scratches in the matrix.

    SEM Micrographs of the used TSPROF Blitz F1000 stone. Not the massive scratches and plastic deformation. Instrument: Zeiss GeminiSEM560 Scanning Electron Microscope.

    One can even spot some grains that have moved and ploughed along the matrix. Pretty cool shot!

    White light interferometry height map of the diamond surface on the used stone. Instrument used: Zygo Nexview NX2, Objective Lens: 10X. Stitched overview of 4×4 images, detail view of 1 FOV.

    The height map of the surface shows a bit more even distribution of high and low spots. In the detail view, the diamonds, and especially some missing are noticeable. Because this is a very fine stone, the parameter table is nearly identical to the first one:

    Some initial wear has reduced the total height (Sz) as well as the material ratio (Sdc), but no significant changes.

    Looking at the individual diamonds, I identified some without any wear, and some with. This is totally normal, as not all grains have contact with your material – only the ones sticking out have. This is why you typically dress a grinding wheel – to even out the surface. Now, the internet believes that you can’t dress galvanic grinding media, because it’s a single layer. I’ll let this stand for a later blog post. Let’s start with our detail peeking with a unused grain:

    SEM micrograph of a single diamond grain. Note the very low accelerating voltage (500 V) and detector type (InLens). This not only reduces charging effects, but reveals all of the fine, intricate surface structures of the diamond. Instrument: Zeiss GeminiSEM560 Scanning Electron Microscope.

    Compared to this undamaged grain, let’s take a look at one that is just barely used:

    SEM micrograph of a single diamond grain, with initial wear visible at the topmost tip. Instrument: Zeiss GeminiSEM560 Scanning Electron Microscope.

    You can clearly make out a very small section of the topmost part of the grain, where initial wear is happening. Wear on diamonds on steel is always chemically motivated, as some diffusion is happening. Nevertheless, the wear is abrasive in appearance. What is happening here is that typically, diamond is so hard, that abrasion shouldn’t be a major factor (10000 HV compared to 1000-1200 HV even for the hardest steels). This is because of the structure (NaCl lattice structure, two FCC lattice sells translated half a cell into each other), but also because of the bond between atoms – the so called sp3 hybridisation, that forms a very strong connection. By bringing the diamond in contact with steel, and applying energy (e.g. force and temperature), the sp3 bond is broken into a sp2 orbital, which is the one dominant in graphite. The current understanding is, that chemical potential and energy influx change the surface of the diamond to basically a graphite layer (and some much more complex changes, that would require a blog post on their own), which then can be abrasively removed (and some diffusion into the steel also happens).

    SEM micrograph of a heavily used diamond grain. Note the very flat top plateau with clear directional abrasive marks. Instrument: Zeiss GeminiSEM560 Scanning Electron Microscope.

    If this process continues, the grain is slowly flattened. This typically improves surface finish, as less micro edges and flatter large cutting edges create smoother surfaces. At a certain point, typically when the diamond grain flattening reaches it’s largest surface area, the diamonds are torn out of the galvanic bond. As most galvanic stones are single layered, the stone is then “done” and will be replaced. This is also the reason why a lot of manufacturers talk about “breaking in” and the stone becoming “finer” over use. Obviously, the grain size distribution is not becoming finer. You are just reducing outliers and flattening the cutting profile, so it appears finer. A side effect here is an increased cutting pressure, which reduces your “sharpening speed” if you keep the same pressure on the knife edge.

  • A brief study on sharpening stones – Part 2 – DMT mini W7C (Blue, coarse)

    This is part of a series of blog posts – looking into the appearance and composition of commercially available sharpening stones. If you are interested in the previous episode, Part 1 is about the Fällkniven DC3.

    If you have some suggestion on what I should look at next, or want to share your super secret DIY stones, I could be persuaded to open the bag of analytical devices… hit me up on Instagram under @marvgro for that.

    Today’s sharpening stone is the DMT mini diamond-coated stone, specifically the “blue” medium coarse one. According to the manufacturers homepage, this is the “quick” solution to transform a dull knife to proper sharpness. It’s a diamond abrasive with 45 micrometre size. Apparently, it sharpens quicker because of the micronized monocrystalline diamond surface 🙂 *DrMarv smiles in marketing-speech*

    Optical Micrograph of the diamond side. Note the “engineered surface”, aka massive diamond free areas that are recessed. Magnification and scale bar are visible on the lower right part of the image. Microscope: Leica Emspira

    Immediately visible on the sharpening stone is the “engineered” surface structure. The very thin metal layer that is coated in diamonds is fixed to a blue plastik body, which is likely fiber reinforced to add stiffness. The circular cutouts are recessed. This allows for room for the swarf – likely a reason why these stones are very aggressive and useable without water or oil. Moreover, circular, large radius milling marks (I’d guess a large insert cutter or flycutter) is visible as periodic structures along the surface. The diamond coating on an optical level is very dense and coarse.

    SEM Micrographs of the DMT W7C stone. The funky looking structures in the plastic recess is charge-up from the electrons, as the plastik is totally non conducting. Instrument: Thermo Fischer PhenomXL Scanning Electron Microscope

    SEM pictures reveal a dense coating of diamonds. This is very close to what professional, manufacturing level galvanic coated grinding tools look like and is a statement to professional level galvanic organisation. Having many grits and a nice, dense coating means a decent lifetime, but also lot’s of kinematic active cutting edges. This is a diamond sharpening stone with a quick material removal rate. Grain distribution is pretty regular, but quite a bit larger than the advertised 45 microns. Grain shape isn’t very coarse or sharp. My guess here is that by increasing the grain size over the advertising, but reducing grain sharpness, a similar surface quality with longer lifetime is possible.

    Energy dispersive x-ray spectroscopy (EDS) inside the scanning electron microscope show the diamond grain (C) as well as the galvanic binder around the grains (Ni). Instrument: Thermo Fischer PhenomXL Scanning Electron Microscope

    Chemical analysis shows exactly what one would expect – diamond in a nickel binder from the galvanic process. Something noteworthy here is the extreme stick-out of the grain. This is one heck of a sharp tool. The downside of such a stickout is that grain retention is low, and even on this unused and brand new stone you can immediately identify some “impressions” in the nickel binder where grains previously were stuck but got lost along shipping / handling.

    White light interferometry height map of the diamond surface. Instrument used: Zygo Nexview NX2, Objective Lens: 10X. Stitched overview of 3×3 images and 6×6 fields of view.

    The surface scans from the white light interferometer show pretty much what was already visible inside the optical microscope: large, recessed circular areas, as well as the feedmarks from the manufacturing process, which create some waviness alonge the surface. periodicity of this waviness seems to be in the range of 0.2 mm, with an amplitude of around 10 micrometre. I think this won’t be noticeable on a hand-held sharpening stone, but could be felt as “vibration” on a guided system.

    This is quite a bit coarser than the Fällkniven diamond stone we looked at in part 1 of this series. Sa and Sq are already in the double digit range, with a very large spread in Sdc visible. The grain profile isn’t very sharp, which is visible in the sub-3 value of the kurtosis (Sku).

  • A brief study on sharpening stones – Part 1 – Fällkniven DC3

    The absurd amount on sharpening stones on the market should ring some alarm bells. The first is: there must be a lot of money in this. The second: what’s the difference between them? The third: which is the ideal one (for me)?

    I’ve ordered and then analysed a couple of different grinding stones. This is probably going to become an ongoing series of blog posts, whenever I get new and exciting grinding stones. If you have some suggestion on what I should look at next, or want to share your super secret DIY stones, I could be persuaded to open the bag of analytical devices… hit me up on Instagram under @marvgro for that.

    Fällkniven DC3 (diamond/ceramic whetstone)

    According to the manufacturer’s homepage, this is a “diamond grit 25 micron, sapphire ceramic grit 5 micron”. Let’s take a look!

    Optical Micrograph of the diamond side. Magnification and scale bar are visible on the lower right part of the image. Microscope: Leica Emspira

    The diamond side is coated in TiN. Typically, this coating can be found on cheaper HSS tooling, as it’s quite hard (2400-2700 HV), but also slick and doesn’t let chips adhere. It’s a curious choice to put on a grinding stone, as the grit used here (diamond) is quite a bit harder – depending on the grain orientation, it clocks in at 10000 HV. It’s certainly nice looking though, and I’d postulate that this is the main reason it is applied to any sharpening stone.

    SEM Micrographs of the Fällkniven DC3 stone. It shows quite a large range of grain sizes. Instrument: Thermo Fischer PhenomXL Scanning Electron Microscope

    SEM pictures show gritty, sharp diamonds. The range distribution of the visible grains (measured at their largest diagonal distance) ranges from 50 to 75 micrometre, with a strong weighting towards the upper end. The grit’s have a distinct checkered look to them – this is the coating, sticking to some parts of the diamond, and not adhering to others. It is very likely that the first use of the stone would remove the coating at any point that is in contact with a blade.

    Energy dispersive x-ray spectroscopy (EDS) inside the scanning electron microscope show the coating (Ti, N), the diamond grain (C) as well as the galvanic binder around the grains (Ni). Instrument: Thermo Fischer PhenomXL Scanning Electron Microscope

    In order to faciliate a better sense of depth and size, a surface scan was undertaken via white light interferometry. This creates a very high resolution height map – the Z resolution here is absurdly small, where’s the X/Y resolution (“spatial resolution”) follows the Abbe diffraction limited law.

    White light interferometry height map of the diamond surface. Instrument used: Zygo Nexview NX2, Objective Lens: 10X. Stitched overview of 4×4 images.

    We can see the typical galvanic bound height distribution – unevenly spaced grains with some very high outliers. This is the main reason that galvanic stones leave larger scratches and commonly a worse surface than a similar grain sized vitrified or resin bound stone.

    ISO 25178 surface parameters of the Fällknives DC3 diamond side.

    The ISO25178 parameters show a rough surface (Sa/Sq are the arithmetic respective quadratic surface roughness). Sz is the total height of the surface. Very indicative of the distribution is the parameter “Sdc”, which shows the range between the lowest 10% and highest 90% of the measured points. This is a good indicator how “even” the height distribution is. A perfect flat surface would have a value of 0 here, whereas a widely spread surface shows a wider range. It’s a usefull parameter to compare stones, but leaves out the 10% outliers at every end. Sku, the kurtosis shows how “sharp” the surface data is. Typically, a value below 3 is considered flat, whereas values above 3 are considered very sharp.

    The other “ceramic” side shows a typical ceramic abrasive mix.

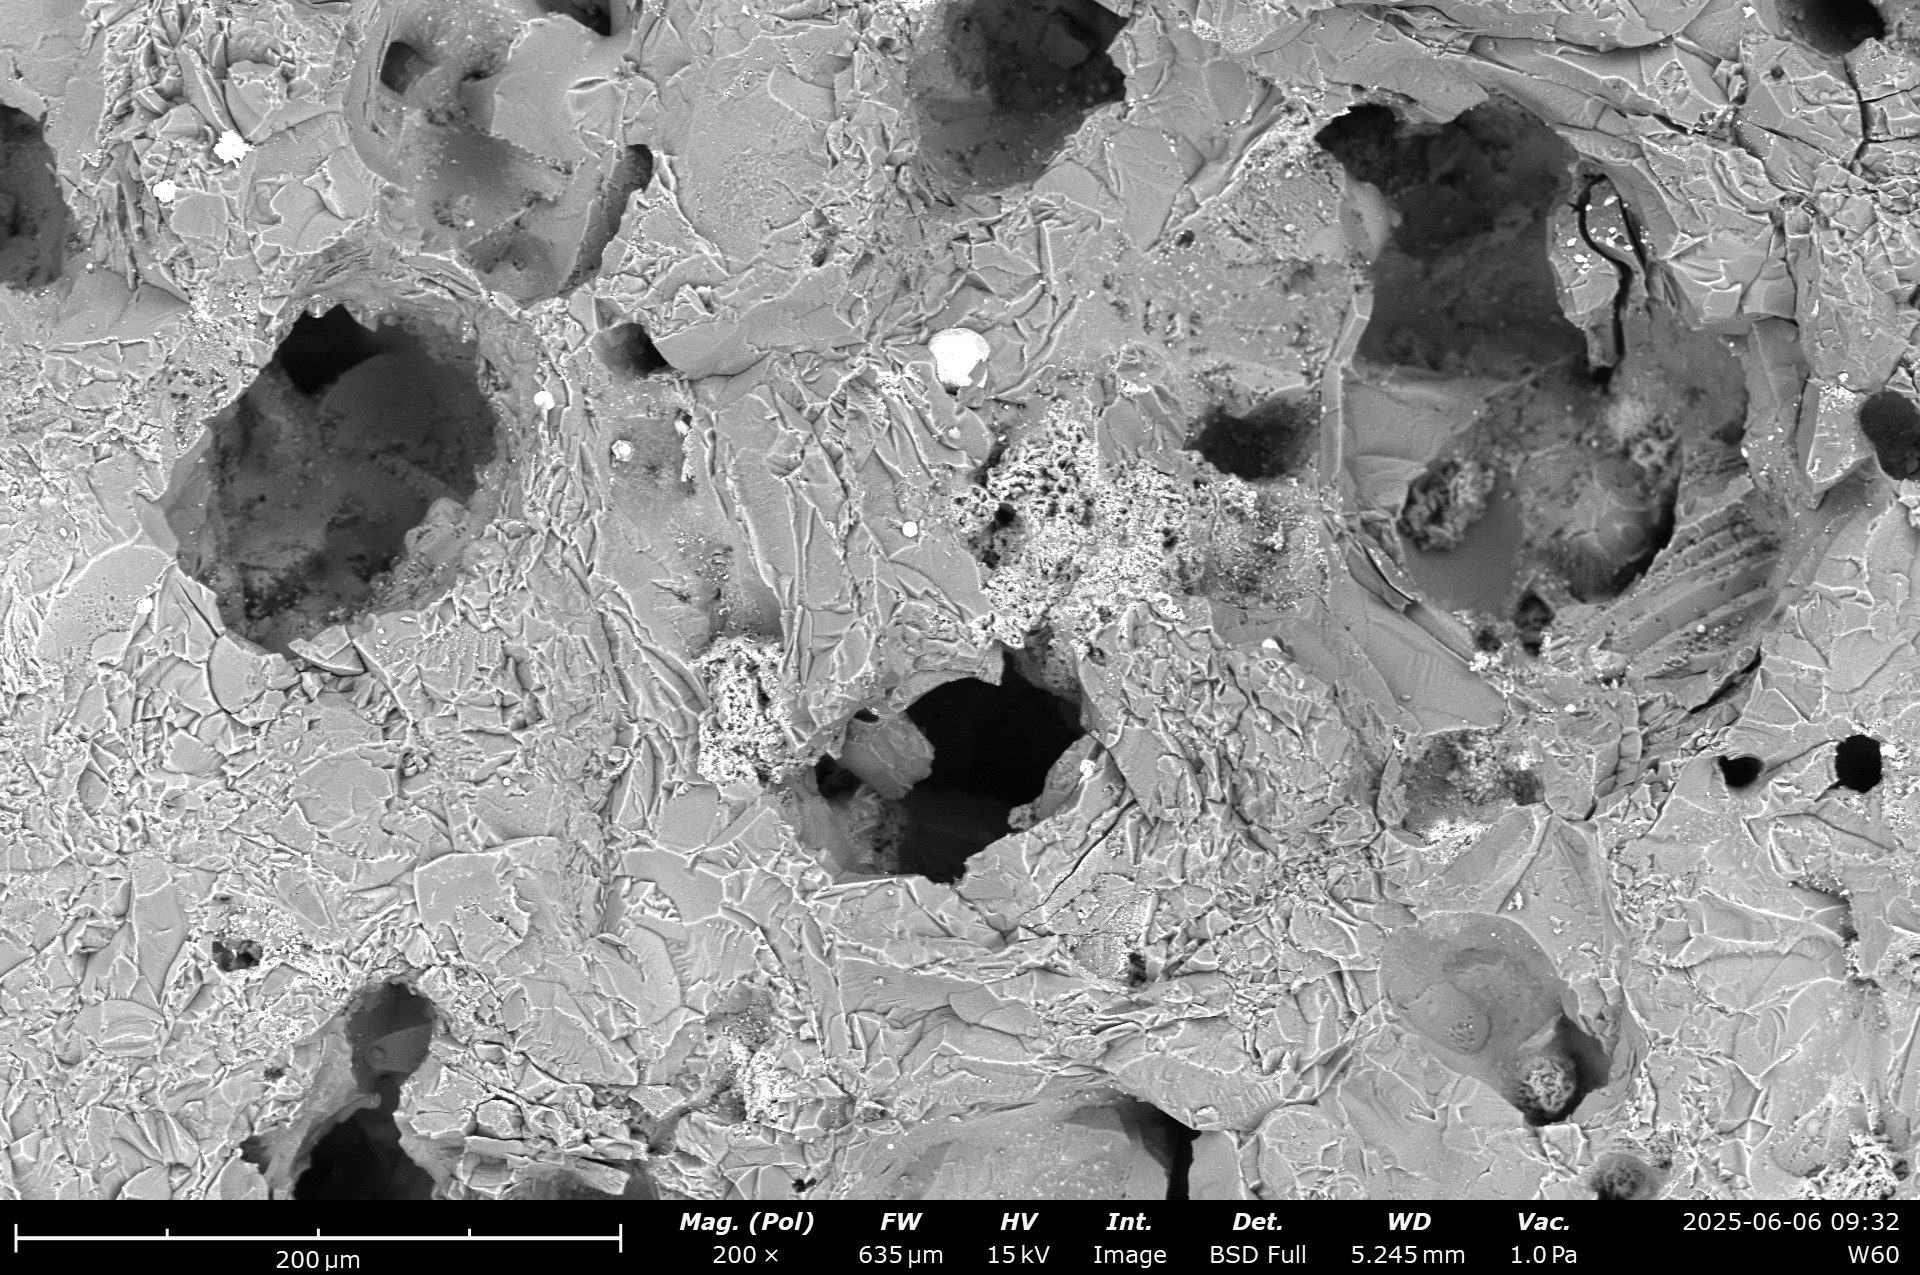
    SEM images show a pretty uniform, surface with some large voids.

    SEM micrographs of the surface morphology. A typical, sintered alumina oxide appearance with some foreign particles (darker colour in the BSD image) and large voids are visible. Instrument: Thermo Fischer PhenomXL Scanning Electron Microscope

    While the void size is suprising, this certainly allows for some swarf build-up. 🙂 Some metal particles (bright white colour), but also some different abrasive grains (slightly darker grains) are visible. The detector used is a back-scatter detector. Here, besides the topographical contrast, one also has a contrast based on the weight of the element. The rule of thumb here is: the heavier the element, the brighter the returned pixel is. Pure metals are typically the brightest, whereas ceramics or diamonds are of darker colour.

    EDS analysis of the chemical composition. The colour corresponds to the individual element, visible above the scale bar. Instrument: Thermo Fischer PhenomXL Scanning Electron Microscope

    Chemical analysis show several large SiC grains, as well as Al2O3 grains. As sapphire is chemically Al2O3, just in a monocrystalline configuration, I think we have identified plenty about the compoistsion. Trace elements of metals and Calciumoxide (blue colours) are likely impurities from manufacturing.

    White light interferometry height map of the ceramic surface. Instrument used: Zygo Nexview NX2, Objective Lens: 10X. Stitched overview of 4×4 images.

    The whitelight interferometry surface map shows a relatively rough surface. large voids are visible, the range of height values doubles compared to the diamond size. On the other hand, the uppermost part of the surface shows a higher plateau region. The contact area likely is higher on this stone side. Sku, the kurtosis shows how “sharp” the surface data is. Typically, a value below 3 is considered flat, whereas values above 3 are considered very sharp. Here, a much lower value than on the diamond surface can be seen.

    Combined with the low sharpness of the dull ceramics, a burnishing effect is expected, improving the appearance of a blade with very low effort.

    ISO 25178 surface parameters of the Fällknives DC3 ceramic side.